


Why Dimensionality Reduction Helps ??
Edition #141 | May 23, 2025


Master AI Agents & Build Fully Autonomous Web Interactions!
STARTS TOMORROW
Experienced Instructor from American Express
Limited number of 50% scholarships are available for needy students. To apply, please email vipul@businessanalyticsinstitute.com with a brief explanation of your situation.
Starts Tomorrow | Enroll Now | Get Prompt Engineering E-Book Free
Hello!
Welcome to today's edition of Business Analytics Review!
If you’ve ever felt overwhelmed by datasets with countless features—like trying to find your way through a maze blindfolded—you’re not alone. High-dimensional data is a common challenge in AI and machine learning, but Dimensionality Reduction Algorithms like PCA, t-SNE, and UMAP can simplify the chaos while keeping the core insights intact. Today, we’re diving into these three powerful techniques, exploring their mathematical foundations and real-world applications. With a mix of technical insights and relatable examples, let’s make sense of these tools in a way that’s engaging and easy to follow.

Why Dimensionality Reduction Matters
Imagine you’re a data scientist at an e-commerce company, tasked with analyzing customer behavior. Your dataset includes hundreds of features: purchase history, browsing time, click patterns, and more. Visualizing or modeling this data in its raw form is like trying to read a book in a foreign language without a translator. Dimensionality reduction steps in to reduce the number of features, making data more manageable for visualization, modeling, or interpretation. It tackles the “curse of dimensionality,” where too many features lead to sparse data, increased computation, and overfitting risks. PCA, t-SNE, and UMAP each offer unique ways to simplify data, but their approaches and ideal use cases differ significantly.
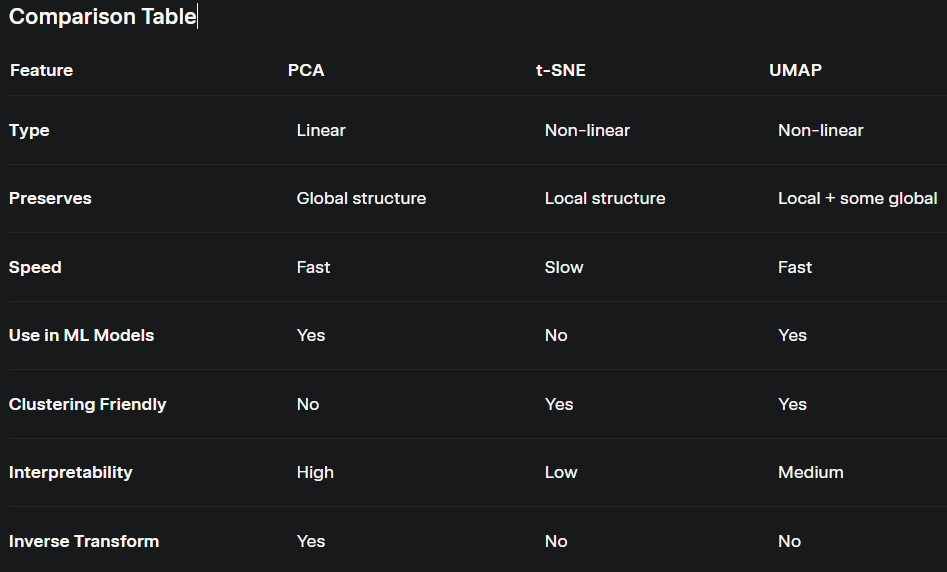
Comparing PCA, t-SNE, and UMAP
Let’s break down these algorithms, exploring how they work mathematically and where they shine in practice. Think of them as different tools in your data science toolbox, each suited for specific tasks.
PCA: The Reliable Workhorse
Principal Component Analysis (PCA) is the dependable veteran of dimensionality reduction, like a trusty pickup truck that gets the job done. It’s a linear technique that transforms high-dimensional data into a lower-dimensional space by finding principal components—directions that capture the maximum variance in the data. Mathematically, PCA computes the eigenvectors and eigenvalues of the data’s covariance matrix. The eigenvectors define new axes (principal components), and the data is projected onto these axes, prioritizing those with the highest variance.
How It Works: PCA assumes that the most important information lies in the directions where the data varies the most. By projecting data onto these principal components, it reduces dimensions while retaining as much variance as possible. It’s deterministic, meaning you’ll get the same results every time, and it’s computationally efficient.
Use Case: PCA is ideal for scenarios where you need to reduce features for predictive modeling or when data has linear relationships. For example, in finance, PCA is used to analyze stock market data, identifying key patterns across thousands of stocks to simplify portfolio analysis. It’s also used in image compression, reducing pixel data while preserving image quality. However, PCA struggles with non-linear relationships, where data patterns are more complex.
Example: Picture a dataset of customer demographics for a retail chain. PCA can reduce features like age, income, and spending habits into a few principal components, making it easier to feed into a linear regression model to predict customer lifetime value.
t-SNE: The Cluster Artist
t-Distributed Stochastic Neighbor Embedding (t-SNE) is the creative genius of the group, specializing in revealing clusters in complex data. Unlike PCA, t-SNE is a non-linear technique that focuses on preserving local relationships—keeping similar data points close together in the lower-dimensional space. It converts similarities between data points into probabilities and minimizes the divergence (using Kullback-Leibler divergence) between these probabilities in high and low dimensions.
How It Works: t-SNE models the probability that pairs of points are neighbors in the original high-dimensional space and tries to maintain these relationships in 2D or 3D. It’s stochastic, meaning results can vary slightly between runs unless a random seed is set, and it’s computationally intensive, especially for large datasets.
Use Case: t-SNE is a go-to for exploratory data analysis when you want to visualize clusters. In biology, it’s widely used to visualize single-cell RNA sequencing data, helping researchers identify distinct cell types based on gene expression patterns. It’s also popular in natural language processing for visualizing word embeddings, showing how words with similar meanings cluster together. However, t-SNE is less suitable for large datasets due to its computational cost and isn’t typically used in model pipelines because it lacks an inverse transform.
Example: Imagine analyzing social media posts to understand user sentiment. t-SNE can reduce high-dimensional text embeddings into a 2D plot, revealing clusters of positive, negative, and neutral posts, helping marketers tailor their campaigns.
UMAP: The Versatile Innovator
Uniform Manifold Approximation and Projection (UMAP) is the new kid on the block, combining the best of PCA and t-SNE. It’s a non-linear technique that preserves both local and global data structures, making it versatile for various applications. UMAP is grounded in manifold learning and topological data analysis, assuming the data lies on a lower-dimensional manifold. It constructs a high-dimensional graph of the data and optimizes a low-dimensional graph to match it, balancing local and global relationships.
How It Works: UMAP uses concepts from topology to maintain the data’s structure, making it faster and more scalable than t-SNE. Like t-SNE, it’s stochastic and requires hyperparameter tuning (e.g., number of neighbors), but it’s more efficient and can handle larger datasets.
Use Case: UMAP is excellent for large datasets where both local clusters and global patterns matter. In genomics, UMAP visualizes high-dimensional gene expression data, helping researchers understand cellular relationships. In image analysis, it can reduce pixel data to visualize how images cluster, such as distinguishing between different types of handwritten digits in the MNIST dataset. Its speed and scalability make it a favorite in fields like bioinformatics and NLP.
Example: Suppose you’re working on a recommendation system for a streaming platform. UMAP can reduce user interaction data (e.g., watch history, ratings) into a 2D space, revealing clusters of users with similar tastes, which can inform personalized recommendations.
When to Choose Each:
PCA: Opt for PCA when speed, simplicity, or interpretability is crucial, or when dealing with linearly separable data, such as in financial modeling or image compression.
t-SNE: Choose t-SNE for visualizing complex, clustered data in small to medium datasets, like biological or text data, where local relationships are key.
UMAP: Use UMAP for large datasets or when you need to balance local and global structures, such as in genomics or large-scale NLP tasks.
Recommended Reads
Mastering Dimensionality Reduction
This guide provides an in-depth look at PCA, t-SNE, and UMAP, covering their implementation and use cases to help you tackle high-dimensional data with confidence.Visualizing the Invisible in Your Data
This article compares PCA, t-SNE, and UMAP with real-world use cases, visual examples, and Python code, making it a great resource for practical learning.Dimensionality Reduction for Data Visualization
Focused on visualization, this article uses the Sign Language MNIST Dataset to compare PCA, t-SNE, UMAP, and LDA, offering insights into their visualization capabilities
Trending in AI and Data Science
Let’s catch up on some of the latest happenings in the world of AI and Data Science:
Unikie’s Nordic AI Lab Ambitions
Unikie is boosting investments in AI development, aiming to become the leading AI lab in the Nordics. The company seeks to drive innovation and solidify its technological leadership in the region.Taiwan's Computex shows off robotics, AI innovations
Taiwan’s Computex tech show opened in the capital Taipei, bringing together thousands of global participants with advanced AI technology and robotics systems on display.
Malaysia Softens Huawei AI Ties
Malaysia initially announced plans for a Huawei-powered national AI system but quickly distanced itself, reflecting the country’s delicate position amid US efforts to limit China’s AI influence.
Trending AI Tool: Orange Data Mining

Orange Data Mining is an open-source data visualization and analysis tool that makes machine learning and data mining accessible through visual programming or Python scripting. Its intuitive interface lets you build workflows by connecting widgets, enabling tasks like dimensionality reduction, clustering, and predictive modeling without coding. Orange supports techniques like PCA and t-SNE, making it ideal for exploring high-dimensional data. Whether you’re a beginner or an expert, Orange is a powerful tool for uncovering insights in your data.
Learn more

Master AI Agents & Build Fully Autonomous Web Interactions!
Experienced Instructor from American Express
- A hands-on, 4-weeks intensive program with expert-led live sessions.
- Batch Size is 10, hence you get personalized mentorship.
- High Approval Ratings for the past cohorts
- Create Practical AI Agents after each session
Limited number of 50% scholarships are available. To apply, please email vipul@businessanalyticsinstitute.com with a brief explanation of your situation.
Starts Tomorrow | Enroll Now | Get Prompt Engineering E-Book Free