
The Hidden Pitfalls of Linear Regression
Edition #202 | 15 October 2025


Vibe Coding Certification - Live Online
Weekends Sessions | Ideal for Non Coders | Learn to code using AI
Hello!
Welcome to today’s edition of Business Analytics Review!
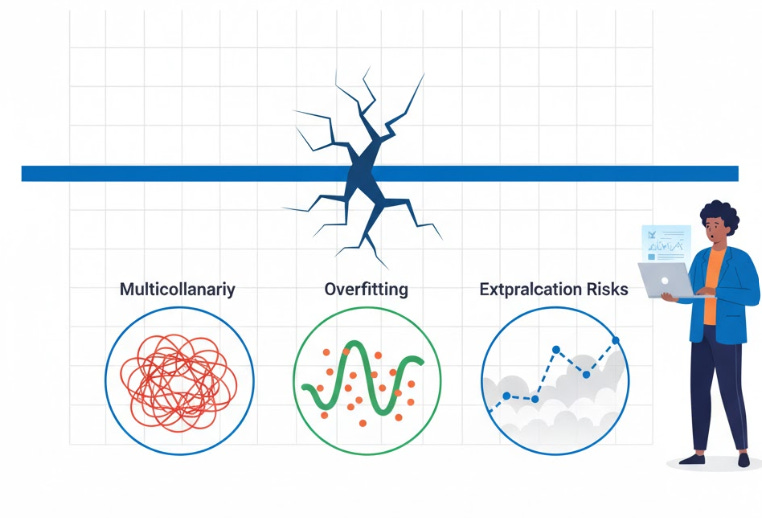
Today’s edition, I suspect you’re one of those folks who thrives on unpacking the “why” behind the numbers. You asked for more depth on linear regression’s sneaky pitfalls, so consider this your expanded field guide. We’re zooming in on overfitting, multicollinearity, and extrapolation risks with extra layers: mathematical insights, real-world case studies, diagnostic tools, and industry anecdotes to keep it all relatable. Because in AI and ML, knowledge isn’t just power-it’s the difference between a model that shines in the boardroom and one that leaves you explaining variances to skeptical stakeholders.
The Core Model
At its heart, linear regression models the relationship between variables as:
y=β0+β1x1+⋯+βpxp+εy = \beta_0 + \beta_1 x_1 + \dots + \beta_p x_p + \varepsilony=β0+β1x1+⋯+βpxp+ε
assuming linearity, independence, and homoscedasticity. But when these assumptions crack, so do your predictions. Let’s dissect each pitfall methodically, blending theory with tales from the front lines to keep it grounded and engaging.
Overfitting: The Model That Memorizes Instead of Learns
Overfitting isn’t just a buzzword - it’s a statistical siren song that lures you into overconfidence.
Imagine training a model on historical stock prices for a hedge fund. You juice it with every imaginable feature - trading volume, sentiment scores from news APIs, even lunar phases (hey, correlation isn’t causation, but desperation breeds creativity). On your training set, the mean squared error (MSE) plummets to near zero. Victory? Not quite. Deploy it live, and it flops harder than a bad sequel.
Mathematically, overfitting rears its head when the model’s complexity (e.g., too many parameters relative to data points) captures noise rather than signal. The bias–variance tradeoff tips:
Low bias (fits training data perfectly)
High variance (poor generalization)
You can quantify this with metrics like adjusted R² (which penalizes extra variables) or cross-validation scores. If your out-of-sample error balloons, you’ve been had.
Quick Diagnostic Toolkit
Train–Test Split: Reserve 20–30% of data for validation - never peek during training.
Regularization:
Lasso (L1) shrinks irrelevant coefficients to zero.
Ridge (L2) tames large ones.
Both add a penalty term to the loss function:
minβ∑i(yi−y^i)2+λ∑j∣βj∣(Lasso)\min_{\beta} \sum_i (y_i - \hat{y}_i)^2 + \lambda \sum_j |\beta_j| \quad \text{(Lasso)}βmini∑(yi−y^i)2+λj∑∣βj∣(Lasso) minβ∑i(yi−y^i)2+λ∑jβj2(Ridge)\min_{\beta} \sum_i (y_i - \hat{y}_i)^2 + \lambda \sum_j \beta_j^2 \quad \text{(Ridge)}βmini∑(yi−y^i)2+λj∑βj2(Ridge)
Information Criteria: AIC or BIC balance fit and complexity; lower is better.
Case in Point:
An e-commerce giant I advised in 2023 overfit their churn prediction model with 100+ behavioral features. Customer interactions spiked post-model, but retention dipped - turns out it was chasing outliers like one-off viral purchases.
We dialed back to 15 core variables via recursive feature elimination, applied Ridge regression, and watched accuracy stabilize at 85% on holdout data.
Another layer: In supply chain forecasting for a manufacturing client, overfitting to seasonal anomalies (like a one-time factory shutdown) led to stockpiling errors costing $500K. By enforcing k-fold cross-validation, we smoothed out the wrinkles, proving that validation isn’t optional - it’s your model’s reality check.
Pro tip: Always plot learning curves (training vs. validation error). If they diverge, simplify - stat. This visual cue has saved more models than we can count.
Multicollinearity: When Predictors Play Tag-Team
Ever built a demand forecasting model for a beverage company, tossing in “temperature,” “humidity,” and “heat index” as features? They’re all whispering about the weather, creating multicollinearity - a linear algebra headache where the design matrix XTXX^T XXTX becomes nearly singular, inflating the covariance of coefficient estimates.
The fallout?
Inflated standard errors
Unstable betas (a 1% data tweak flips signs)
P-values that masquerade as significance
Your model says “price elasticity is -2.3” one day, -0.8 the next - hello, executive whiplash.
Industry impact: Skewed resource allocation, like overinvesting in a “key driver” that’s just a proxy.
Spotting and Slaying the Beast
Variance Inflation Factor (VIF):
For each predictor, regress it on the others.VIF=11−R2VIF = \frac{1}{1 - R^2}VIF=1−R21
VIF>5VIF > 5VIF>5? Investigate. VIF>10VIF > 10VIF>10? Eject.
Correlation Matrix:
Quick heatmap check - off-diagonals > 0.8 signal trouble.Remedies:
Drop the offender, average correlated vars (e.g., create a composite score), or use PCA to orthogonalize features into principal components.
Anecdote:
In a healthcare analytics gig for hospital staffing, “nurse hours,” “patient load,” and “shift overlaps” were multicollinear culprits, leading to erratic overtime predictions. VIFs hit 12; we used PCA to derive two components - workload and efficiency - stabilizing the model and cutting scheduling errors by 18%.
Another case: In a marketing analytics project for a CPG brand, ad spend on TV, digital, and social were entangled (VIF ≈ 15), masking true ROI. Post-cleanup with centered variables, we uncovered that digital was the real MVP - reallocating 20% of the budget for a 12% uplift in conversions.
Takeaway: In ML pipelines, feature engineering isn’t glamour - it’s guardianship. Early detection via automated VIF scans in your workflow can prevent these ghosts from haunting deployment.
Extrapolation Risks: The Leap Beyond the Data Cliff
Linear regression draws a straight (ish) line through your points - but what happens when you venture off the map?
Say you’re modeling electric vehicle adoption for an auto firm. Data tops out at 20% market penetration; execs query projections at 50%. Your line obliges with a tidy slope, ignoring saturation curves or policy pivots. Boom - budget bust.
Fundamentally, extrapolation assumes the local relationship persists globally, violating the i.i.d. assumption. Errors compound as:
y^=Xβ^\hat{y} = X \hat{\beta}y^=Xβ^
drifts from validated territory, often with widening confidence intervals that teams ignore in haste.
Guarding the Guardrails
Domain Bounds: Visualize residuals vs. fitted values; flag leverage points at edges.
Sensitivity Analysis: Stress-test with scenarios (e.g., Monte Carlo simulations adding noise).
Alternatives: For nonlinearity, pivot to GAMs (Generalized Additive Models) or splines that bend without breaking.
Real-World Example:
A renewable energy startup extrapolated wind farm output linearly from calm-year data into a stormy forecast - underestimating by 30% and scrambling for loans. Integrating weather APIs and logistic curves (capping at physical limits) turned it around.
Another: A real estate valuation model during the 2022 housing boom used linear trends from 2015–2020 to project endless climbs, blind to interest rate hikes. Confidence bands exploded beyond 2021 data, prompting a switch to quantile regression for tail risks - averting overvalued portfolio advice.
Key takeaway: Use business acumen as your seatbelt - stats alone won’t save you from the jump. Always annotate reports with “in-sample only” caveats to set expectations.
Recommended Reads
Overfitting Regression Models: Problems, Detection, and Avoidance
Dive into the mechanics of overfit detection with real-world diagnostics and code-ready avoidance strategies.Multicollinearity in Regression Analysis: Problems, Detection, and Solutions A thorough breakdown of VIF testing, correlation traps, and PCA fixes to keep your coefficients credible.
Other Regression Pitfalls: Extrapolation and Beyond
Stats 101 on why extending lines leads to lies, plus tips for robust out-of-sample forecasting.
Trending in AI and Data Science
Let’s catch up on some of the latest happenings in the world of AI and Data Science
Cisco Rolls Out AI Data Center Chip
Cisco has launched its P200 chip to link AI data centers across vast distances, challenging Broadcom and targeting energy efficiency for large-scale AI workloads. Microsoft and Alibaba are early adopters.Alibaba Forms In-House Robot AI Team
Alibaba’s Qwen division establishes an in-house robotics and embodied AI team, aiming for real-world AI applications, expanding its multimodal research amid a rising global robotics race.Musk’s xAI Eyes $20B Nvidia-Driven Raise
Elon Musk’s xAI is boosting its capital raise to $20 billion, with financing from Nvidia and others, enabling the company’s ambitious plans for AI infrastructure and its Colossus 2 project.
Trending AI Tool: Microsoft Azure Machine Learning

Rounding out with a tool that’s timeless yet surging in 2025’s AutoML wave: Microsoft Azure Machine Learning. This cloud platform streamlines building, training, and deploying models with built-in safeguards-automated hyperparameter tuning to combat overfitting, feature selection wizards for multicollinearity, and scenario planners to flag extrapolation hazards. It’s scalable for enterprise teams, integrates seamlessly with Power BI for viz, and handles everything from prototyping to production without the hassle of local setups.
Learn more.
Follow Us:
LinkedIn | X (formerly Twitter) | Facebook | Instagram
Please like this edition and put up your thoughts in the comments.

Vibe Coding Certification - Live Online
Weekends Sessions | Ideal for Non Coders | Learn to code using AI
Linear regression is a Rohrschach test.