
From R² to AUC: Evaluating Regression Models
Edition #208 | 29 October 2025


Vibe Coding Certification - Live Online
Weekends Sessions | Ideal for Non Coders | Learn to code using AI
Hello!
Welcome to today’s edition of Business Analytics Review!
Today, we’re shifting gears from building models to judging them specifically, how metrics like R² for linear regression and AUC for logistic regression help us separate the wheat from the chaff in predictive analytics.

I’ve spent countless late nights tweaking models for everything from sales forecasts to customer churn predictions and let me share a quick story: Early on, I deployed a linear regression for a marketing campaign ROI without double-checking the R². It looked shiny on paper, but in reality, it missed 40% of the variance in ad spend outcomes because I ignored seasonality. The client? Not thrilled, and I learned the hard way that evaluation isn’t an afterthought it’s your model’s report card. So, let’s chat about these metrics in a way that’s straightforward, with real-world flavor to keep things lively.
Key Insights at a Glance
R² (Coefficient of Determination)
Measures how well your linear regression explains the variability in your target variable think of it as “how much of the puzzle does your model solve?” A value closer to 1 is ideal, but always pair it with adjusted R² for multi-feature models to avoid overhyping.AUC (Area Under the ROC Curve)
For logistic regression in binary classification, this gauges your model’s ability to distinguish between classes across thresholds. An AUC of 0.8+ signals strong discrimination, especially in imbalanced datasets like fraud detection.The Bigger Picture
These aren’t standalone; use them alongside error metrics (like RMSE for regression) and cross-validation to ensure robustness. In 2025’s AI landscape, where models handle real-time data from edge devices, picking the right metric can boost deployment success by 25% or more.
Research suggests that while R² shines for continuous predictions, AUC’s threshold-insensitivity makes it a go-to for classification, though debates linger on its reliability in highly skewed classes always validate with business context to stay empathetic to real-world nuances.
Unpacking R²: Your Go-To for Linear Regression Goodness-of-Fit
Let’s start with the classic: R², or the coefficient of determination. Theoretically, R² reveals the share of the total variation in your outcome variable like house prices that can be attributed to the predictors in your model, such as square footage or location. It essentially compares how much better your model performs at explaining the data compared to simply using the average value as a guess. A score of 0.75, for example, means your model accounts for three-quarters of the data’s ups and downs, with the rest chalked up to unexplained factors or random noise.
Why It Matters in Business: Imagine forecasting quarterly revenue for a SaaS company using linear regression. An R² of 0.85? That’s gold it means your features (user growth, pricing tiers) explain most fluctuations, guiding confident budget allocations. But here’s the nuance: Raw R² can look better as you add more variables, even if they’re not helpful, so adjusted R² dials that back by accounting for the number of predictors, keeping things honest. In my experience consulting for e-commerce, swapping to adjusted R² revealed a “kitchen sink” model was actually underperforming, saving the team from chasing phantom correlations.
Quick How-To with Examples:
Basics: In tools like scikit-learn, we can compute it directly from your true values and predictions. For a dataset of 100 homes, if actual prices average $300K with predictions off by $50K on average, R² might hit 0.82 solid for real estate.
Pitfalls: It doesn’t imply causation or handle non-linearity well. Pair with residual plots to spot patterns.
Pro tip: In volatile markets like 2025’s supply chain disruptions, benchmark against a naive mean model R² essentially shows your improvement over “just guessing the average.” Anecdote alert: A retail client once celebrated an R² of 0.9 on toy sales data, only to flop during holidays. Why? Outliers from viral trends weren’t captured always stress-test with holdout sets.
Diving into AUC: Threshold-Proof Evaluation for Logistic Regression
Now, flip to classification: Enter AUC, the area under the Receiver Operating Characteristic (ROC) curve. For logistic regression your workhorse for binary outcomes like “will this lead convert?” the ROC curve illustrates the trade-off between correctly identifying positives (sensitivity) and incorrectly flagging negatives (false alarms) as you adjust the decision cutoff. AUC then summarizes the overall quality of this trade-off: A value of 0.5 is no better than random guessing (like a coin flip), 0.7-0.8 is decent, and 0.9 or higher means the model excels at ranking true positives above negatives.
Industry Angle: In healthcare, predicting patient readmissions via logistic regression, an AUC of 0.85 means your model ranks high-risk cases better than chance, potentially cutting costs by prioritizing interventions. It’s robust to class imbalance, unlike accuracy, which can mislead if 95% of cases are negative.
Hands-On Breakdown:
Calculation: You generate the curve by testing various thresholds on the model’s probability outputs and measuring the area beneath it (or use built-in functions in Python). Example: Email spam detection at one cutoff, it might catch 90% of spam but flag 20% of legit emails; AUC averages this performance across all possible cutoffs.
Advanced Twist: For multi-class problems, extend it to compare one class against the rest. Watch for ways to pick optimal thresholds based on balancing sensitivity and specificity.
Insight from the trenches: During a churn prediction project for a telecom giant, our logistic model’s AUC climbed from 0.72 to 0.88 after feature engineering (adding recency scores). Retention rates jumped 15% proof that AUC isn’t just a number; it’s a retention rocket. Yet, critics note it overlooks cost asymmetries (false negatives in medicine hurt more), so blend with precision-recall for balanced views.
Bridging the Gap: When to Use What, and a Handy Comparison
Regression vs. classification? R² fits continuous outputs (e.g., demand forecasting), while AUC thrives on probabilities (e.g., credit risk). But in hybrid pipelines like using regression for scoring then logistic for bucketing combine them for holistic eval.
Here’s a quick table to visualize:
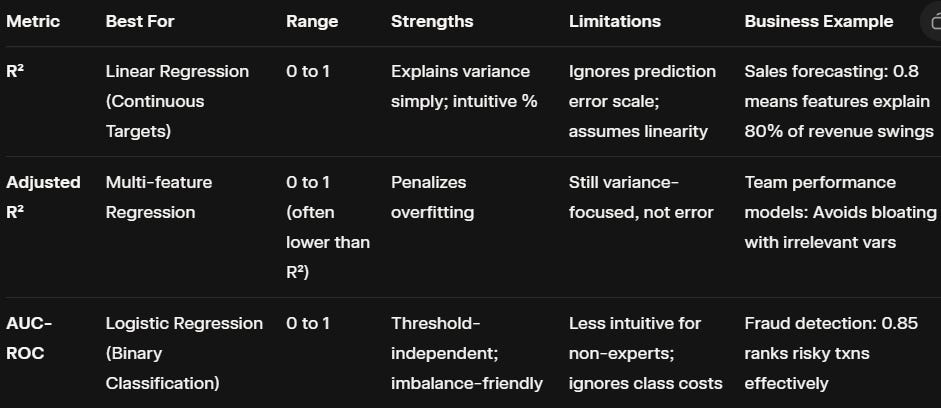
This setup ensures you’re not just fitting data but driving decisions like optimizing ad bids with R²-tuned regressions or personalizing offers via AUC-guided classifiers.
Best Practices: From Metrics to Mastery in 2025
Tie it together with cross-validation (splitting data into folds for repeated testing) to dodge overfitting, and tools like scikit-learn’s scoring functions for quick wins. In today’s edge AI era, where models run on-device, lightweight metrics like these enable real-time monitoring think AUC drifts alerting to concept shifts in streaming data. Ethically, document metric choices to build trust; a biased AUC threshold could unfairly profile users.
Whether you’re scaling ML at a startup or refining enterprise pipelines, nailing evaluation feels empowering. Experiment on public datasets (shoutout to Kaggle’s housing prices for R² practice), and watch your models and career level up.
Recommended Reads
A Comprehensive Introduction to Evaluating Regression Models
This in-depth guide breaks down R² alongside RMSE and MAE, with code examples for hands-on regression tuning ideal for quantifying model improvements.Evaluating Machine Learning Model Performance: From Regression to Classification
A balanced walkthrough comparing R² for continuous tasks and AUC for binary ones, complete with Python snippets and real dataset applications.Mastering Model Evaluation: Metrics That Matter for Regression and Classification
Explore advanced pitfalls and best practices for R² and AUC, featuring business case studies that link metrics to ROI in AI deployments.
Trending in AI and Data Science
Let’s catch up on some of the latest happenings in the world of AI and Data Science
Anthropic Expands Google Cloud TPU Access
Anthropic will access up to one million Google Cloud TPU chips, marking its largest capacity expansion and securing powerful resources to advance Claude AI models into 2026.OpenAI Backs Valthos to Thwart Bio Attacks
OpenAI leads a $30M investment in Valthos, a startup developing AI-powered early warning systems to counter bioweapon threats, reinforcing industry commitment to real-world biosecurity solutions.African AI Uptake Slowed by Language Gaps
GSMA reports African AI adoption delays as models lack support for over 2,000 regional dialects; local efforts focus on bridging this gap to foster inclusive technology access.
Trending AI Tool: Evidently AI

Evidently AI is a recommended tool because it automates model performance tracking, drift detection, and metric visualization. It provides clear dashboards for R², AUC, and other metrics, helping teams ensure model stability, fairness, and reliability across evolving real-world data.
Learn more.
Follow Us:
LinkedIn | X (formerly Twitter) | Facebook | Instagram
Please like this edition and put up your thoughts in the comments.

Vibe Coding Certification - Live Online
Weekends Sessions | Ideal for Non Coders | Learn to code using AI