
Freemium: Survival Analysis in Machine Learning
Edition #349 | 14 July 2026

Hello!
Welcome to today’s edition of Business Analytics Review!
I’m thrilled you’ve joined me as we dive into one of the most practical yet often underappreciated areas of machine learning: Survival Analysis.
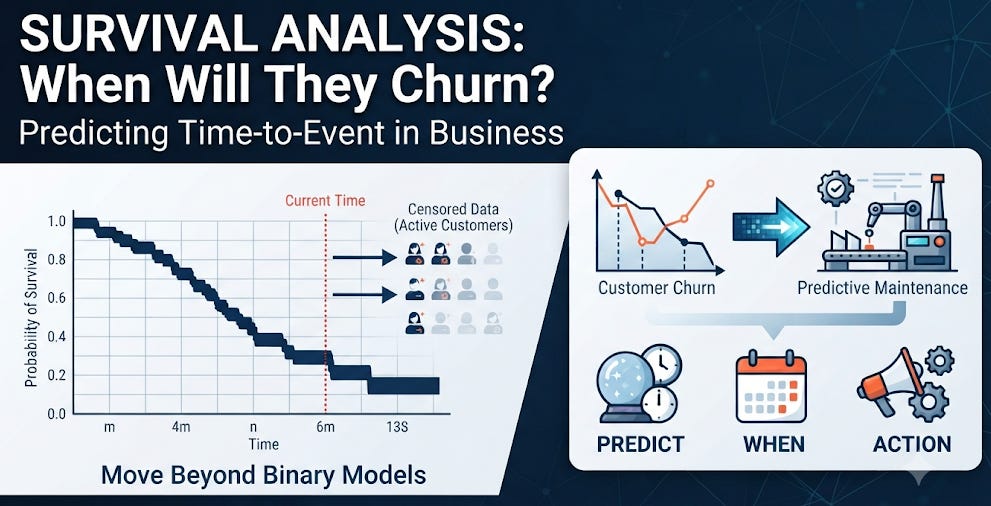
Picture this: You’re a subscription-based SaaS company watching customers quietly slip away. Or you’re managing a fleet of industrial machines where unexpected breakdowns cost thousands per hour. Traditional churn models or failure predictions often treat these as simple binary outcomes “will they leave?” or “will it break?” but they miss the crucial when. Survival analysis shines exactly here. It models the time until an event occurs, gracefully handling the messy reality of censored data situations where we don’t observe the full timeline for every subject.
Whether you’re forecasting customer lifetime value, predicting equipment maintenance needs, or even analyzing clinical trial outcomes in healthcare AI applications, survival techniques give you richer, more actionable predictions. Today, we’ll explore the fundamentals, statistical foundations, machine learning extensions, real-world business applications, challenges, and forward-looking trends. Let’s make this complex topic feel approachable and immediately useful.
Why Survival Analysis Matters in Today’s AI-Driven Business Landscape
In the fast-paced world of business analytics, time is literally money. Standard classification models (think logistic regression for churn) ignore the temporal aspect and the partial information from customers who are still active or machines that haven’t failed yet. Survival analysis, rooted in statistics but supercharged by modern ML, addresses this head-on.
Censoring is the key concept that makes it special. There are right-censored observations (the most common the event hasn’t happened by the end of our study period), left-censored, and interval-censored data. Ignoring censoring leads to biased estimates. For example, if you only look at customers who churned within 12 months and average their tenure, you systematically underestimate true lifetime because loyal customers are underrepresented.
This methodology originated in medical research (time until death or relapse) but has exploded in applicability: telecom churn, e-commerce retention, predictive maintenance in manufacturing, credit risk (time to default), and even employee turnover analysis.
Core Statistical Methods: Building Blocks
Let’s start with the classics these are still the workhorses in many organizations.
Kaplan-Meier Estimator: A non-parametric way to estimate the survival function S(t) the probability of surviving past time t. It’s intuitive and great for visualization. You’ll see those classic step-function curves dropping at event times, with confidence intervals widening as data gets sparser.
Imagine plotting customer retention: The curve stays high initially, then drops sharply around contract renewal periods. Anecdote from industry: A streaming service I consulted with used KM curves segmented by acquisition channel and discovered that social media sign-ups had dramatically steeper early drop-offs leading to targeted onboarding improvements.
Cox Proportional Hazards Model: The most widely used semi-parametric model. It doesn’t assume a specific distribution for survival times but estimates how covariates (features like customer segment, usage frequency, pricing tier) influence the hazard rate the instantaneous risk of the event at time t, given survival up to t.
The “proportional” assumption means the effect of covariates is multiplicative and constant over time. You can interpret hazard ratios easily: “Customers on annual plans have 40% lower hazard of churning compared to monthly.” Check assumptions with Schoenfeld residuals!
Accelerated Failure Time (AFT) Models and Parametric Models (Weibull, Exponential, Log-normal): These assume a specific distribution for survival times, offering more structure when the assumption holds. Great for extrapolation.
These statistical tools provide interpretability and statistical rigor crucial for business decisions where stakeholders need to understand why a model predicts what it does.
Machine Learning Meets Survival: Handling Complexity and Censored Data
Traditional stats work well with fewer features, but real business datasets are high-dimensional, nonlinear, and full of interactions. Enter ML adaptations:
Random Survival Forests: Extensions of random forests that handle censored data using specialized splitting criteria (e.g., log-rank test). They capture complex interactions and provide variable importance rankings. Excellent for predictive maintenance features might include sensor readings, usage hours, environmental factors.
Gradient Boosting for Survival (e.g., XGBoost with survival extensions or packages like xgbse): Combines boosting power with survival objectives. Great performance on tabular business data.
Deep Learning Approaches: Neural networks like DeepSurv, DeepHit, or Nnet-survival. These excel with high-dimensional data (images + tabular, text reviews + metrics) and can model competing risks or non-proportional hazards. PyTorch or TensorFlow implementations via libraries like pycox make them accessible.
Handling Censored Data in ML Pipelines: Custom loss functions (e.g., negative log-likelihood adapted for censoring), data preprocessing (creating time and event indicator columns), and evaluation metrics like Concordance Index (C-index, analogous to AUC for ranking), Brier score for calibration over time, or time-dependent ROC.
Example in Action: A manufacturing client used sensor data from IoT devices. Traditional ML predicted “failure within next month” binary, but survival models gave probabilistic remaining useful life (RUL) curves. This shifted maintenance from reactive to predictive, reducing downtime by over 30% while optimizing parts inventory. The ML models incorporated time-varying covariates (e.g., recent vibration spikes) for dynamic risk scoring.
Nuances matter: ML models can overfit noisy business data; regularization and proper cross-validation (time-based or using survival-specific methods) are essential. Interpretability tools like SHAP adapted for survival models help bridge the gap for non-technical stakeholders.
Business Applications and Industry Insights
Customer Churn: Predict not just if but when. Integrate with CLV models for precise ROI on retention campaigns. Segment by survival curves to personalize interventions e.g., proactive discounts for high-risk cohorts at specific tenure points.
Predictive Maintenance: In aviation, energy, or logistics, modeling time-to-failure minimizes costs and safety risks. Combine with reinforcement learning for optimal maintenance policies.
Healthcare & Finance: Patient survival post-treatment or time-to-loan-default. Ethical considerations around fairness (bias in demographics) are paramount use techniques from responsible ML.
Edge cases: Competing risks (e.g., churn vs. upgrade), time-varying effects, left-truncation (delayed entry into study), and sparse events in rare failure scenarios. Always validate on hold-out data with business-relevant horizons.
Anecdote: I once worked with a fintech firm struggling with high early churn. Survival analysis revealed that feature usage in the first 7 days was the strongest predictor. They redesigned the onboarding flow accordingly, boosting 90-day retention significantly. The “aha” moment came from plotting stratified KM curves data visualization often tells the story better than any metric.
Challenges and Best Practices
Data Quality: Accurate timestamps and event definitions are critical. Missing censoring info wrecks models.
Assumption Violations: Test proportional hazards; use time-dependent covariates or stratified models if needed.
Scalability: For massive datasets, distributed computing (Spark + MLlib or Dask) or efficient implementations help.
Evaluation: Don’t rely solely on C-index; look at calibration and decision curve analysis for business utility.
Integration: Embed survival models into broader ML ops pipelines with monitoring for concept drift (e.g., changing customer behaviors post-economic shifts).
Emerging trends: Multi-modal survival models (text + tabular + images), causal survival analysis for intervention effects, and Bayesian approaches for uncertainty quantification vital for high-stakes decisions.
Recommended Reads
A Survival Analysis Guide with Python: Using Time-To-Event Models to Forecast Customer Lifetime
A practical, code-heavy walkthrough applying survival models to real customer data for lifetime value prediction. Read MoreResponsible Machine Learning for Survival Analysis
Explores ethical considerations, fairness, and modern ML techniques in survival contexts essential for responsible AI deployment. Read Morexgbse: Improving XGBoost for Survival Analysis Hands-on introduction to enhancing gradient boosting for time-to-event tasks with practical implementation tips. Read More
Trending in AI and Data Science
Let’s catch up on some of the latest happenings in the world of AI and Data Science
OpenAI unveils long-awaited "super app" as rivalry with Anthropic intensifies
OpenAI launched ChatGPT Work, an enterprise AI agent powered by the new GPT-5.6 model. The product combines ChatGPT and Codex to automate document, presentation, website, and coding workflows for enterprise users.
OpenAI and Google sell AI models to blacklisted China groups
The report says OpenAI and Google have supplied AI models through Singapore entities linked to Chinese companies on U.S. blacklist lists, raising renewed debate over AI export controls and geopolitical regulation
OpenAI releases latest ChatGPT model after delay over White House cybersecurity concerns
Following U.S. government review, OpenAI broadly released GPT-5.6, highlighting growing government oversight of frontier AI models because of cybersecurity and national-security concerns.
Trending AI Tool: Lifelines

This elegant, pure-Python survival analysis library is a must-have for any data scientist or analyst working in this space. It offers intuitive APIs for Kaplan-Meier, Cox models, parametric fits, plotting, and more handling censored data seamlessly with excellent documentation and examples. Whether you’re prototyping quickly or building production pipelines, Lifelines bridges classical statistics and modern applications beautifully. Perfect companion to scikit-learn workflows!
Learn more.
Interesting overview of how adding the time dimension can strengthen decision-making. Understanding not just whether an event will occur, but when, has meaningful applications for customer retention, credit risk, and proactive planning across finance and commercial operations.