Make 2025 your Best Year with This $399 FREE AI Masterclass
AI is reshaping the world— and you need to master it before it masters you!
A 3-hour power-packed workshop covering 25+ AI tools, mastering prompts, and revealing hacks, strategies, and secrets of the top 1%.
Save your seat now (Offer valid for 24 hours only)
Here’s why you can’t miss this:
✅ Learn 30+ cutting-edge AI tools
✅ Automate your workflows and reclaim 20+ hours a week
✅ Create an AI-powered version of YOU
⏲️ Time: 10 AM EST (Tomorrow)
Register here (first 100 people get it for free + $500 bonus) 🎁
Hello !
Welcome to the new edition of Business Analytics Review!
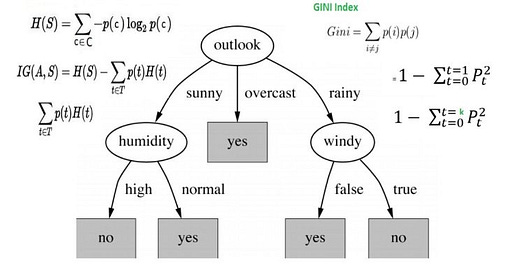
Today, we’re taking a technical dive into the world of decision trees, focusing on the essential splitting criteria: Gini index, entropy, and information gain.
Understanding these concepts is crucial for anyone looking to build effective decision tree models in machine learning. Let’s explore how these metrics work and their significance in creating robust classification algorithms.
What is a Decision Tree?
A decision tree is a flowchart-like structure used for classification and regression tasks. It splits the dataset into subsets based on the value of input features, ultimately leading to a decision or prediction at the leaf nodes. The effectiveness of a decision tree largely depends on how well it splits the data at each node, which is where our splitting criteria come into play.
The Gini index is a measure of impurity or purity used to evaluate potential splits in a dataset. It calculates the probability of misclassifying a randomly chosen element from the dataset if it was randomly labeled according to the distribution of labels in the subset.
A lower Gini index indicates a purer node, meaning that most of the instances belong toa single class. For a detailed explanation of how to calculate Gini index in decision trees, you can refer to this helpful resource on Geeks for Geeks.
Entropy measures the disorder or uncertainty in a dataset. Indecision trees, it quantifies how mixed the classes are at a node.
The goal when using entropy as a splitting criterion is to reduce uncertainty (or disorder) in the data after each split. A high entropy value indicates that the data points are evenly distributed among classes, making predictions difficult. Conversely, lower entropy values suggest that the data points are more homogeneously classified. For an insightful discussion on entropy in machine learning, check out this article from Javatpoint.
Information Gain measures how much information a feature gives us about the class. It is calculated as the difference between the entropy of the parent node and the weighted average entropy of the child nodes after a split, higher information gain indicates that a feature does an excellent job at reducing uncertainty about the target variable. This metric helps determine which feature to split on at each node in the decision tree. To learn more about calculating information gain, you can visit Geeks for Geeks.
Comparing Gini Index and Entropy
Both Gini index and entropy are used as criteria for splitting nodes in decision trees, but they have subtle differences:
Sensitivity: Gini index tends to be more sensitive to changes in class distribution than entropy.
Computational Efficiency: Gini index is generally faster to compute since it doesn’t involve logarithmic calculations.
Performance: Empirical studies have shown that both metrics often yield similar results; however, depending on your specific dataset and problem domain, one may perform better than the other.
Further Resources Reading
Gini Index and Entropy | 2 Ways to Measure Impurity in Data
This article discusses both Gini index and entropy, highlighting their roles in decision tree algorithms and providing examples for clarity.
Read more here
Entropy: How Decision Trees Make Decisions
This blog post explains how decision trees use entropy and information gain to decide on splits during training.
Read more here
Decision Tree in Machine Learning
This comprehensive guide covers everything from basic concepts to practical implementations of decision trees using various splitting criteria.
Read more here
Recommended Video
Tool of the Day - Orange
Orange is a powerful open-source data visualization and analysis tool designed for data mining and machine learning tasks. It provides a user-friendly interface that allows both novices and experienced users to perform complex data analyses without extensive programming knowledge. Learn More Here
If you wish to promote your product / services , please visit here
Thank you for being part of our community! We hope you found this edition insightful. If you enjoyed the content, please give us a thumbs up!


