
Assumption Checks: Getting Regression Models Right
Edition #258 | 25 February 2026

Hello!
Welcome to today’s edition of Business Analytics Review!
Today, we’re zeroing in on something that trips up even seasoned pros: Assumption checks in regression models. Whether you’re building predictive tools for business forecasting or optimizing AI-driven decisions, getting these right can mean the difference between spot-on insights and misleading mishaps.
Think about it – remember that time a retail giant poured millions into a demand prediction model, only for it to flop because they overlooked multicollinearity in their variables? It’s a classic tale from the industry trenches, highlighting how unchecked assumptions can lead to financial losses and strategic errors. We’ll break this down step by step, blending the tech nitty-gritty with real-world vibes to keep things relatable. Let’s jump in!
Why Assumptions Matter in Regression
Before we get technical, let’s chat about the “why.” Regression models, like linear and logistic, are the workhorses of ML in business analytics. They help us predict outcomes – say, sales revenue (linear) or customer churn (logistic) – based on input data. But these models aren’t magic; they’re built on assumptions about how the data behaves. Ignore them, and your model might spit out garbage, leading to bad calls like overstocking inventory or misallocating marketing budgets. On the flip side, validating these assumptions ensures your AI outputs are reliable, ethical, and actionable. In today’s AI landscape, where regulations are tightening around model transparency – think GDPR or emerging AI ethics frameworks – this isn’t just best practice; it’s a business imperative that can safeguard against legal risks and build trust with stakeholders. Moreover, in competitive sectors like finance or healthcare, robust models translate to a tangible edge, such as more accurate risk assessments or personalized recommendations that drive revenue growth.
Key Assumptions for Linear Regression
Linear regression is your go-to when predicting continuous outcomes, like estimating quarterly profits from ad spend and market trends. But it assumes the world is, well, linear and orderly. Here’s the breakdown, with a bit more depth on each to help you spot issues in your own projects:
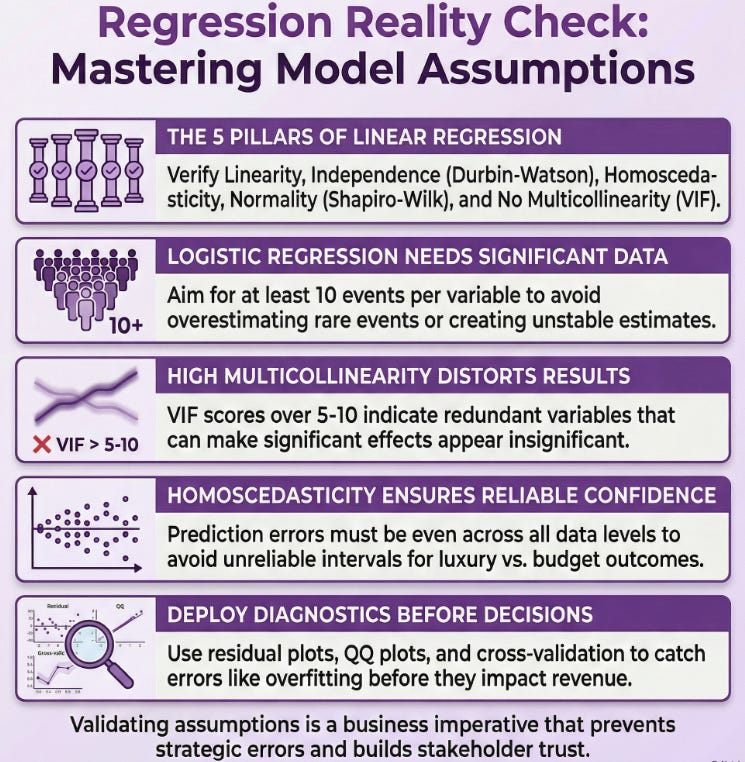
Linearity: The relationship between your predictors (independent variables) and the outcome (dependent variable) should be straight-line-ish. No wild curves! For example, if you’re modeling house prices based on square footage, plot it out – if it looks like a scatter with a clear upward trend without bends, you’re good. In practice, I’ve seen teams in e-commerce skip this and end up with models that overestimate high-end sales because the data curved at the extremes, perhaps due to luxury market saturation. To check, use scatter plots or partial regression plots; if non-linear, consider polynomial terms or alternative models.
Independence: Each observation should stand on its own – no carryover effects. Think of surveying customer satisfaction: if you poll the same group repeatedly, their responses might influence each other, violating this. In AI pipelines, this often crops up with time-series data, like stock prices, where yesterday’s value affects today’s, introducing autocorrelation. Diagnostic tools like the Durbin-Watson test can flag this; values around 2 indicate independence, while deviations suggest issues like serial correlation that might require ARIMA adjustments.
Homoscedasticity: Fancy word for “constant variance.” The spread of residuals (prediction errors) should be even across all levels of your predictors. If errors balloon at higher values – say, bigger prediction misses for luxury vs. budget products – your model needs tweaking, as it could lead to unreliable confidence intervals. Tools like residual plots in Python’s statsmodels library make this easy to check; look for a random scatter without patterns. If heteroscedastic, transformations like Box-Cox or weighted least squares can stabilize variance.
Normality of Residuals: Those errors should follow a normal distribution (bell curve). Why? It ensures your statistical tests, like p-values and t-tests for coefficients, hold water and are interpretable. A quick Shapiro-Wilk test can confirm this, and if it’s off – often in skewed financial data like income distributions – transformations like logging your variables often fix it, or you might resort to non-parametric methods. QQ plots are great visuals here; deviations from the straight line signal problems.
No Multicollinearity: Your predictors shouldn’t be too chummy – high correlations between them (e.g., ad spend and website traffic, since one drives the other) can inflate errors and make coefficients unstable. Use Variance Inflation Factor (VIF) scores; anything over 5-10 screams trouble, indicating redundancy. In such cases, drop variables, use PCA for dimensionality reduction, or combine them into composites.
In my experience consulting for startups, overlooking multicollinearity once led to a model blaming the wrong factors for user growth, costing them a pivot in strategy. Always validate with diagnostics to avoid such pitfalls!
Key Assumptions for Logistic Regression
Switching gears to logistic regression – ideal for binary outcomes, like “will this lead convert?” (yes/no). It uses a sigmoid curve to output probabilities, but shares some DNA with linear regression. Here’s what to watch, expanded with tips for application:
Linearity in the Logit: Not the raw outcome, but the log-odds (logit) of the probability should linearly relate to predictors. For instance, in fraud detection, the logit of “fraud probability” vs. transaction amount should be linear, ensuring the model’s odds ratios make sense. Check with Box-Tidwell tests or partial plots; non-linearity might require spline transformations or generalized additive models.
Independence of Errors: Similar to linear – observations shouldn’t influence each other. In healthcare AI, clustering in patient data from the same hospital could violate this, leading to biased predictions for disease risk due to shared environmental factors. The same Durbin-Watson or runs tests apply, though less common here; clustered standard errors can mitigate if grouping is inevitable.
No Multicollinearity: Again, predictors playing too nice can distort coefficients and odds ratios. Same VIF check applies; high values might inflate standard errors, making significant effects appear insignificant. Address by variable selection or regularization techniques like LASSO.
Large Sample Size: Logistic needs plenty of data, especially with multiple predictors. Rule of thumb: at least 10 events per variable to avoid overfitting or unstable estimates. Skimp here, and your estimates wobble – I’ve seen small-sample models in marketing analytics overestimate rare events like viral campaigns, leading to overoptimistic projections. Bootstrapping can help validate in low-data scenarios.
Binary or Ordinal Outcome: For basic logistic, your dependent variable must be two categories, with no intermediate states assumed. Extensions like multinomial handle more, but assumptions tighten around category independence. Ensure your data coding is clean – misclassified outcomes can skew everything.
A fun anecdote: A fintech firm I know used logistic for loan approvals but ignored logit linearity, resulting in models that unfairly flagged low-income applicants due to non-linear income effects. Post-check, they refined it with interactions and boosted approval accuracy by 15%. Moral: Assumptions aren’t just academic; they drive fair AI and better business outcomes.
Common Pitfalls and Real-World Fixes
Even pros slip up. Overfitting happens when you force-fit data ignoring assumptions, like assuming normality in skewed e-commerce returns data, leading to models that perform well in training but flop in production. Or, in industry, external shocks (hello, 2020s pandemics) can break independence by introducing temporal dependencies. Other traps include ignoring outliers that violate normality or assuming homoscedasticity in volatile markets like crypto trading. Fixes? Use robust diagnostics in tools like scikit-learn, cross-validate with techniques like k-folds to test generalizability, or switch to alternatives like random forests or SVM if assumptions persistently fail. In business, this means iterating – test, tweak, deploy with A/B testing to measure real impact. It’s like tuning an engine for peak performance: regular checks prevent breakdowns and ensure efficiency in AI-driven decisions.
Recommended Reads
Assumptions of Logistic Regression, Clearly Explained
Explores key assumptions with theoretical explanations and Python code for checks. Read MoreHoly Grail for Understanding All the Assumptions of Linear Regression
Breaks down the five core assumptions, testing methods in SAS, and troubleshooting steps. Read MoreUnderstanding the Difference Between Linear and Logistic Regression Models
Compares the two models, highlighting their unique assumptions and when to use each. Read More
Trending in AI and Data Science
Let’s catch up on some of the latest happenings in the world of AI and Data Science
Nvidia close to finalizing $30 billion investment in OpenAI funding round, FT reports
Nvidia is nearing a $30 billion investment in OpenAI’s funding round, as reported by the Financial Times. This massive deal underscores Nvidia’s strategic push into AI leadership amid booming demand for its chips.UAE to deploy 8 exaflop supercomputer in India
Abu Dhabi’s G42 and Cerebras will deploy an 8-exaflop AI supercomputer in India with partners MBZUAI and C-DAC. Announced at AI Impact Summit 2026, it boosts India’s sovereign AI infrastructure for research and enterprises while ensuring data security.Emirates Health Services, Boston Health AI launch UAE’s first AI Physician Assistant
Emirates Health Services partnered with Boston Health AI to launch “Amal,” UAE’s first AI physician assistant. Unveiled at WHX Dubai 2026, Amal conducts patient interviews, generates clinical summaries, and enhances efficiency with full data sovereignty.
Trending AI Tool: Theorizer

Wrapping up with a fresh gem: Theorizer from the Allen Institute for AI. This cutting-edge tool automates synthesizing scientific theories from research papers, perfect for ML pros digging into advanced regression techniques or theory-building.
Learn more.
Follow Us:
LinkedIn | X (formerly Twitter) | Facebook | Instagram
Please like this edition and put up your thoughts in the comments.